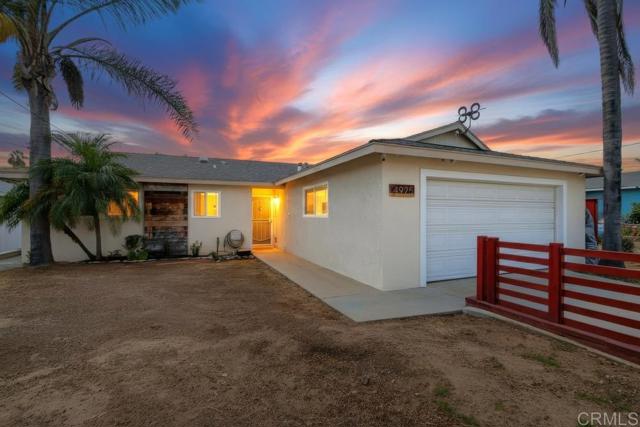
4925 Siesta Drive, Oceanside, CA 92057
4925 Siesta Drive, Oceanside, CA 92057
Property Description
3 bed, 2 full bath with 2-car garage. Spacious floor plan gives you both a living room and family room plus a cozy fireplace. Fully remodeled kitchen with plenty of cabinet space and newer appliances. Newer upgraded fixtures and dual-pane windows throughout. Both baths completely redone with designer tile, fixtures. lighting and wainscoting. Skylight and whole-house fan keep it bright and comfortable. Step outside to your private backyard and the star of the show—a just-renovated heated in-ground pool and spa. Move-in ready and fully upgraded. Libby Elementary 8/10 rating within walking distance from home.
Features & Amenities
Property Details
Mortgage Calculator
Current Rates
Comparative Market Analysis
Affordable Tier · 5 active · 5 closed
Oceanside · Single Family Residence
Listed in line with the median closed sale of $800,000.
Price Position
Aligned with the market — fair pricing for the comps.
Active Properties (5)
Active Comparables
| Address | City | Year | BD | BTH | SqFt | LotSz | LP/SqFt | LP | DIM | Score |
|---|---|---|---|---|---|---|---|---|---|---|
| 309 Clementine Street | Oceanside | 1952 | 3 | 2 | 1,430 | 5,345 | $1,573 | $2.25M | 74 | 90 |
| 4037 Vista Calaveras Street | Oceanside | 1970 | 3 | 2 | 1,410 | 7,600 | $762 | $1.07M | 67 | 87 |
| 1491 Puritan Way | Oceanside | 1989 | 3 | 2 | 1,680 | 5,662 | $321 | $540,000 | 97 | 83 |
| 2050 Trevino Avenue | Oceanside | 1979 | 3 | 3 | 1,693 | 5,316 | $555 | $939,000 | 58 | 82 |
| 3902 Vista Campana | Oceanside | 1972 | 2 | 2 | 1,292 | 2,120 | $464 | $600,000 | 63 | 81 |
| Total: 5 · Average | 2.8 | 2.2 | 1,501 | 5,208.6 | $735 | $1.08M | 71.8 | |||
| Median | 1,430 | $939,000 | ||||||||
Closed Properties (5)
Closed Comparables
| Address | City | Year | Date | BD | BTH | SqFt | LotSz | LP | SP | SP/SqFt | SP/LP | DIM | Score |
|---|---|---|---|---|---|---|---|---|---|---|---|---|---|
| 106 Lancer Ave | Oceanside | 1974 | 09/29/2026 | 3 | 2 | 1,320 | 6,200 | $675,000 | $715,000 | $542 | 1.06 | 46 | 90 |
| 3621 Vista Campana | Oceanside | 1967 | 09/21/2026 | 3 | 2 | 1,480 | 0 | $615,000 | $591,000 | $399 | 0.96 | 52 | 89 |
| 4016 Mira Costa Street | Oceanside | 1968 | 09/18/2026 | 4 | 2 | 1,551 | 9,147 | $1.05M | $1.06M | $683 | 1.01 | 35 | 87 |
| 3011 Jacqueline Lane | Oceanside | 1963 | 10/06/2026 | 4 | 2 | 1,302 | 10,890 | $844,000 | $800,000 | $614 | 0.95 | 21 | 84 |
| 5389 Blackberry Way | Oceanside | 1988 | 09/21/2026 | 3 | 3 | 1,576 | 6,028 | $879,000 | $880,000 | $558 | 1.00 | 31 | 83 |
| Total: 5 · Average | 3.4 | 2.2 | 1,445.8 | 8,066.25 | $809,200 | $809,200 | $559.2 | — | 37 | ||||
| Median | 1,480 | $800,000 | $800,000 | ||||||||||
Market Analysis
List vs Sale $/SqFt
Sale Price Trend
Days on Market
Sale vs List Price
This analysis was generated automatically from MLS data. For an in-depth, human-reviewed valuation, contact Joseph Sardella at josephsardella@gmail.com.