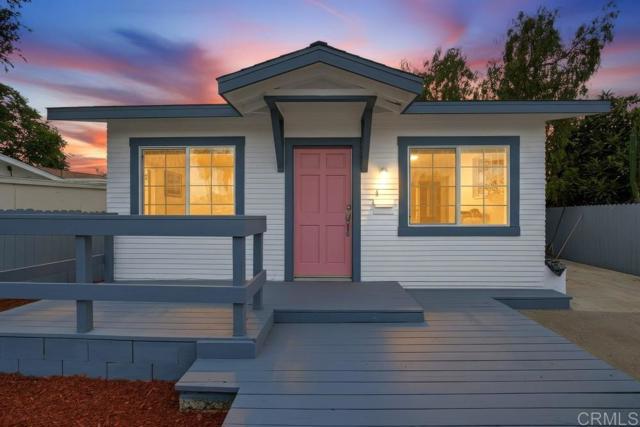
4845 Wightman Street, San Diego, CA 92105
4845 Wightman Street, San Diego, CA 92105
Property Description
This cozy home features hardwood floors, a walk-in closet, canyon views and fresh paint inside and out. It is near shops and public transportation. The back yard has great potential! Lots of space to build a deck and/or to start a fruit, vegetable or herb garden. A-I-generated conceptual image for illustrative purposes only. Improvements shown do not currently exist and are subject to buyer investigation, design review, permits, and approvals.
Features & Amenities
Property Details
Mortgage Calculator
Current Rates
Comparative Market Analysis
Affordable Tier · 5 active · 5 closed
San Diego · Single Family Residence
Listed in line with the median closed sale of $657,000. Price per sqft ($1,135) is a 13% premium to closed comps ($1,001).
Price Position
Aligned with the market — fair pricing for the comps.
Active Properties (5)
Active Comparables
| Address | City | Year | BD | BTH | SqFt | LotSz | LP/SqFt | LP | DIM | Score |
|---|---|---|---|---|---|---|---|---|---|---|
| 2636 Howard Avenue | San Diego | 1925 | 2 | 1 | 646 | 2,244 | $1,262 | $815,000 | 39 | 88 |
| 338 Hoitt Street | San Diego | 1928 | 2 | 2 | 660 | 3,577 | $1,008 | $665,000 | 10 | 87 |
| 4171 36Th Street | San Diego | 1925 | 2 | 1 | 666 | 3,484 | $1,314 | $875,000 | 85 | 86 |
| 4338 33 rd Place | San Diego | 1925 | 2 | 1 | 768 | 4,791 | $1,172 | $899,900 | 86 | 85 |
| 35 19Th Street | San Diego | 2000 | 2 | 1 | 602 | 2,613 | $995 | $599,000 | 96 | 82 |
| Total: 5 · Average | 2.0 | 1.2 | 668.4 | 3,341.8 | $1,150.2 | $770,780 | 63.2 | |||
| Median | 660 | $815,000 | ||||||||
Closed Properties (5)
Closed Comparables
| Address | City | Year | Date | BD | BTH | SqFt | LotSz | LP | SP | SP/SqFt | SP/LP | DIM | Score |
|---|---|---|---|---|---|---|---|---|---|---|---|---|---|
| 4627 Idaho Street | San Diego | 1923 | 10/01/2026 | 1 | 1 | 516 | 7,001 | $598,810 | $657,000 | $1,273 | 1.10 | 28 | 91 |
| 4166 Newton Avenue | San Diego | 1925 | 10/06/2026 | 2 | 1 | 760 | 5,103 | $450,000 | $400,000 | $526 | 0.89 | 75 | 88 |
| 2501 L St. | San Diego | 1917 | 07/27/2026 | 2 | 1 | 632 | 1,680 | $630,000 | $630,000 | $997 | 1.00 | 81 | 87 |
| 3688 35Th Street | San Diego | 1925 | 08/28/2026 | 2 | 1 | 728 | 4,356 | $799,000 | $840,000 | $1,154 | 1.05 | 29 | 86 |
| 4411 McClintock | San Diego | 1936 | 09/21/2026 | 2 | 1 | 672 | 2,777 | $759,000 | $710,000 | $1,057 | 0.94 | 123 | 85 |
| Total: 5 · Average | 1.8 | 1.0 | 661.6 | 4,183.4 | $647,400 | $647,400 | $1,001.4 | — | 67.2 | ||||
| Median | 672 | $657,000 | $657,000 | ||||||||||
Market Analysis
List vs Sale $/SqFt
Sale Price Trend
Days on Market
Sale vs List Price
This analysis was generated automatically from MLS data. For an in-depth, human-reviewed valuation, contact Joseph Sardella at josephsardella@gmail.com.