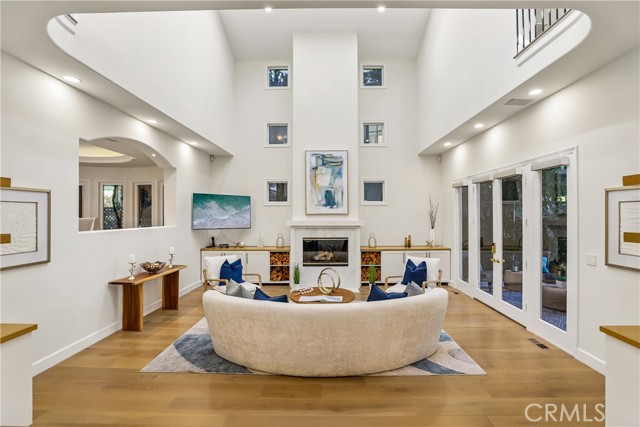
2300 John Street, Manhattan Beach, CA 90266
2300 John Street, Manhattan Beach, CA 90266
Property Description
Some homes win you over with the house. This one starts with the street. Set on coveted John Street in Manhattan Beach’s Tree Section—one of the neighborhood’s wider and most desirable streets—this beautifully remodeled Cape Cod estate pairs an A++ location with exceptional scale. The extra street width allows parking on both sides while still maintaining a spacious, open feel, a rarity in the Trees. Add a prized Martyrs-area setting near American Martyrs Church and School, and the location alone makes a compelling case. Then there’s the size: approximately 5,220 sq. ft. of living space on an oversized approximately 6,700 sq. ft. corner lot—both notably generous for the Tree Section. Inside, a dramatic two-story foyer, curved staircase, expansive windows and wide-plank oak floors set a warm, sophisticated tone. Every bedroom enjoys an en suite bath, while a main-level suite with French doors to the yard is ideal for guests or multigenerational living. The gathering spaces shine, led by a bespoke kitchen with Cambria countertops, oversized island, custom cabinetry, 8-burner range, beverage refrigerator and glass wine display. Upstairs, the primary suite feels like a private retreat with a two-sided fireplace, window seat, covered balcony with outdoor fireplace and bonus room for work, wellness or lounging. The spa-inspired bath adds skylights, sauna, soaking tub, spacious shower and custom walk-in closet. A flexible ADU brings even more possibility, with sliding glass walls opening to the garden, kitchenette and full bath—perfect for guests, an office, studio, wellness space or added value. Outside, Jerusalem stone, mature landscaping, turf, custom lighting, fire pit and Mont Alpi outdoor kitchen create an effortless setting for entertaining. Exceptional street. Exceptional lot. Exceptional scale. And a beautifully reimagined home in one of the Tree Section’s most sought-after locations.
Features & Amenities
Property Details
Mortgage Calculator
Current Rates
Comparative Market Analysis
Luxury Tier · 5 active · 5 closed
Manhattan Beach · Single Family Residence
Listed 23.8% above the median closed sale of $5,975,000. Price per sqft ($1,417) is a 20% premium to closed comps ($1,182). Luxury tier — fewer comparable sales widen the confidence range.
Price Position
Positioned above the market — commands a premium.
Active Properties (5)
Active Comparables
| Address | City | Year | BD | BTH | SqFt | LotSz | LP/SqFt | LP | DIM | Score |
|---|---|---|---|---|---|---|---|---|---|---|
| 1731 Ruhland Avenue | Manhattan Beach | 2020 | 5 | 6 | 5,186 | 7,500 | $1,080 | $5.60M | 6 | 80 |
| 1013 10th Street | Manhattan Beach | 2026 | 5 | 7 | 5,016 | 7,491 | $1,670 | $8.38M | 130 | 77 |
| 1612 Gates Avenue | Manhattan Beach | 2025 | 5 | 6 | 5,080 | 7,510 | $1,161 | $5.90M | 272 | 74 |
| 640 33rd Street | Manhattan Beach | 2026 | 6 | 8 | 5,001 | 5,024 | $1,500 | $7.50M | 68 | 74 |
| 1619 6th | Manhattan Beach | 1990 | 5 | 4 | 4,904 | 7,504 | $815 | $4.00M | 24 | 73 |
| Total: 5 · Average | 5.2 | 6.2 | 5,037.4 | 7,005.8 | $1,245.2 | $6.27M | 100 | |||
| Median | 5,016 | $5.90M | ||||||||
Closed Properties (5)
Closed Comparables
| Address | City | Year | Date | BD | BTH | SqFt | LotSz | LP | SP | SP/SqFt | SP/LP | DIM | Score |
|---|---|---|---|---|---|---|---|---|---|---|---|---|---|
| 1627 Gates Avenue | Manhattan Beach | 1999 | 09/25/2026 | 6 | 7 | 5,012 | 7,498 | $3.95M | $3.91M | $780 | 0.99 | 14 | 83 |
| 1823 8th Street | Manhattan Beach | 2026 | 08/28/2026 | 6 | 7 | 5,038 | 7,503 | $5.89M | $5.80M | $1,151 | 0.98 | 105 | 80 |
| 1658 5th | Manhattan Beach | 2026 | 08/17/2026 | 6 | 7 | 5,000 | 7,500 | $6.00M | $5.97M | $1,195 | 1.00 | 53 | 80 |
| 1806 6th Street | Manhattan Beach | 2026 | 08/11/2026 | 6 | 7 | 5,000 | 7,511 | $6.00M | $6.00M | $1,199 | 1.00 | 200 | 80 |
| 840 18th | Manhattan Beach | 2001 | 09/14/2026 | 5 | 6 | 4,738 | 6,402 | $7.50M | $7.52M | $1,587 | 1.00 | 33 | 79 |
| Total: 5 · Average | 5.8 | 6.8 | 4,957.6 | 7,282.8 | $5.84M | $5.84M | $1,182.4 | — | 81 | ||||
| Median | 5,000 | $5.97M | $5.97M | ||||||||||
Market Analysis
List vs Sale $/SqFt
Sale Price Trend
Days on Market
Sale vs List Price
This analysis was generated automatically from MLS data. For an in-depth, human-reviewed valuation, contact Joseph Sardella at josephsardella@gmail.com.