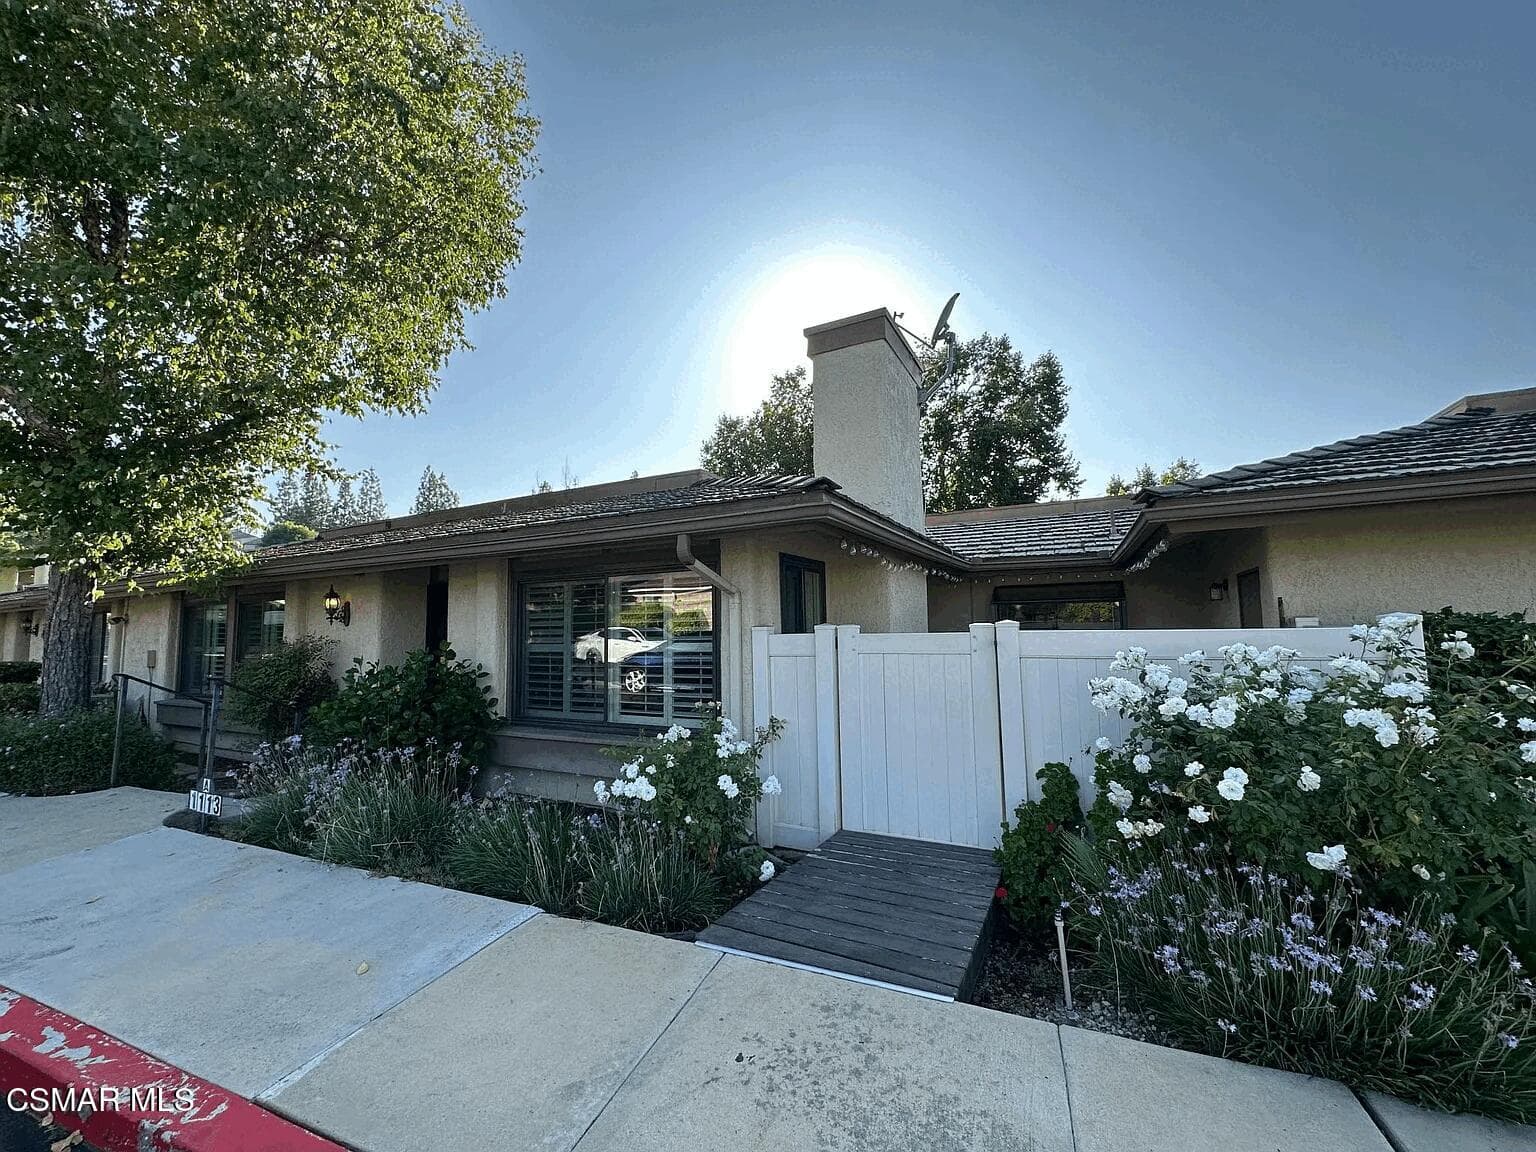
1113 Catlin Street, A, Simi Valley, CA 93065
1113 Catlin Street, A, Simi Valley, CA 93065
Property Description
One of the few rare units with the garage attached. Walk across your private patio to a one car garage. Original owners estate selling. Remodeled kitchen with white shaker cabinets, opened up to the dining area. Spacious Living/dining area with a fireplace. Travertine flooring in the entry, kitchen, hall bath and laundry. Newer water heater and HVAC. Large primary suite with ensuite bath. Flat living area.
Features & Amenities
Property Details
Mortgage Calculator
Current Rates
Comparative Market Analysis
Affordable Tier · 5 active · 5 closed
Simi Valley · Condominium
Listed 17.8% above the median closed sale of $467,000. Closed comps sold at 100% of list — strong seller's market.
Price Position
Positioned above the market — commands a premium.
Active Properties (5)
Active Comparables
| Address | City | Year | BD | BTH | SqFt | LotSz | LP/SqFt | LP | DIM | Score |
|---|---|---|---|---|---|---|---|---|---|---|
| 1113 Catlin Street | Simi Valley | 1981 | 2 | 2 | 1,193 | 1,193 | $461 | $550,000 | 66 | 99 |
| 424 Country Club Drive | Simi Valley | 1986 | 2 | 2 | 1,122 | 1,122 | $561 | $630,000 | 34 | 90 |
| 630 Kingswood Lane | Simi Valley | 1992 | 2 | 2 | 1,145 | 1,145 | $488 | $559,000 | 61 | 88 |
| 600 Kingswood Lane | Simi Valley | 1994 | 2 | 2 | 1,145 | 1,145 | $514 | $589,000 | 26 | 88 |
| 4430 Lubbock Drive | Simi Valley | 1980 | 2 | 2 | 1,193 | 3,484 | $435 | $519,000 | 51 | 87 |
| Total: 5 · Average | 2.0 | 2.0 | 1,159.6 | 1,617.8 | $491.8 | $569,400 | 47.6 | |||
| Median | 1,145 | $559,000 | ||||||||
Closed Properties (5)
Closed Comparables
| Address | City | Year | Date | BD | BTH | SqFt | LotSz | LP | SP | SP/SqFt | SP/LP | DIM | Score |
|---|---|---|---|---|---|---|---|---|---|---|---|---|---|
| 1772 Sinaloa Road | Simi Valley | 1980 | 09/10/2026 | 2 | 2 | 1,092 | 1,092 | $399,000 | $390,000 | $357 | 0.98 | 63 | 94 |
| 3162 Darby Street | Simi Valley | 1981 | 10/09/2026 | 2 | 1 | 1,114 | 1,114 | $415,000 | $426,000 | $382 | 1.03 | 43 | 94 |
| 1736 Sinaloa Road | Simi Valley | 1983 | 08/07/2026 | 2 | 2 | 1,074 | 1,074 | $467,900 | $467,000 | $435 | 1.00 | 64 | 93 |
| 1718 Sinaloa Road | Simi Valley | 1980 | 07/01/2026 | 2 | 2 | 1,074 | 1,074 | $468,000 | $468,000 | $436 | 1.00 | 53 | 92 |
| 2304 Archwood Lane | Simi Valley | 1986 | 09/21/2026 | 3 | 2 | 1,125 | 1,125 | $549,000 | $560,000 | $498 | 1.02 | 66 | 92 |
| Total: 5 · Average | 2.2 | 1.8 | 1,095.8 | 1,095.8 | $462,200 | $462,200 | $421.6 | — | 57.8 | ||||
| Median | 1,092 | $467,000 | $467,000 | ||||||||||
Market Analysis
List vs Sale $/SqFt
Sale Price Trend
Days on Market
Sale vs List Price
This analysis was generated automatically from MLS data. For an in-depth, human-reviewed valuation, contact Joseph Sardella at josephsardella@gmail.com.