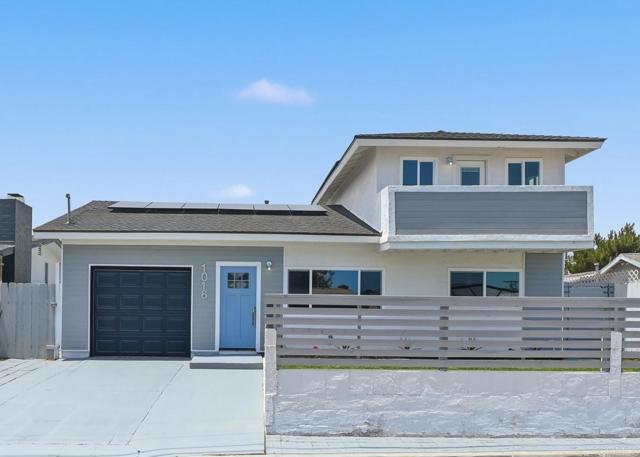
1016 Delaware St, Imperial Beach, CA 91932
1016 Delaware St, Imperial Beach, CA 91932
Property Description
Welcome to your fully renovated coastal retreat in the heart of Imperial Beach! This beautifully updated home blends modern design with effortless indoor-outdoor living, just minutes from the beach. The open-concept floor plan features a stunning new kitchen with contemporary finishes, new flooring throughout, and beautifully remodeled bathrooms. A dramatic folding glass door seamlessly connects the living space to the outdoor entertaining area, creating the perfect setting for enjoying Southern California's coastal lifestyle. Take in breathtaking sunsets from the rooftop patio, offering an ideal space to relax or entertain. Conveniently located near the beach, local dining, shops, and parks, this move-in-ready home delivers the best of modern coastal living.
Features & Amenities
Property Details
Mortgage Calculator
Current Rates
Comparative Market Analysis
Residential Tier · 4 active · 4 closed
Imperial Beach · Single Family Residence
Listed 12.8% above the median closed sale of $972,500. Price per sqft ($610) is a 21% premium to closed comps ($503).
Price Position
Aligned with the market — fair pricing for the comps.
Active Properties (4)
Active Comparables
| Address | City | Year | BD | BTH | SqFt | LotSz | LP/SqFt | LP | DIM | Score |
|---|---|---|---|---|---|---|---|---|---|---|
| 569 Delaware St | Imperial Beach | 2018 | 5 | 3 | 2,061 | 3,750 | $497 | $1.02M | 120 | 82 |
| 558 11th St | Imperial Beach | 2024 | 4 | 3 | 1,643 | 3,500 | $547 | $899,000 | 31 | 77 |
| 1165 East Lane | Imperial Beach | 1981 | 4 | 2 | 1,850 | 6,687 | $535 | $989,000 | 80 | 72 |
| 1250 Connecticut St | Imperial Beach | 1983 | 3 | 2 | 1,413 | 6,410 | $707 | $999,000 | 94 | 64 |
| Total: 4 · Average | 4.0 | 2.5 | 1,741.75 | 5,086.75 | $571.5 | $978,000 | 81.25 | |||
| Median | 1,850 | $999,000 | ||||||||
Closed Properties (4)
Closed Comparables
| Address | City | Year | Date | BD | BTH | SqFt | LotSz | LP | SP | SP/SqFt | SP/LP | DIM | Score |
|---|---|---|---|---|---|---|---|---|---|---|---|---|---|
| 1451 Louden Lane | Imperial Beach | 1962 | 06/04/2026 | 4 | 3 | 2,174 | 6,600 | $1.05M | $1.07M | $492 | 1.02 | 35 | 71 |
| 316 Elkwood Avenue | Imperial Beach | 1952 | 09/11/2026 | 4 | 2 | 2,120 | 6,098 | $1.20M | $1.11M | $526 | 0.93 | 35 | 70 |
| 737 Hemlock Avenue | Imperial Beach | 1960 | 06/26/2026 | 3 | 2 | 1,590 | 6,534 | $900,000 | $875,000 | $550 | 0.97 | 35 | 68 |
| 1208 Florence Street | Imperial Beach | 1991 | 06/18/2026 | 3 | 2 | 1,512 | 6,969 | $649,900 | $670,000 | $443 | 1.03 | 41 | 62 |
| Total: 4 · Average | 3.5 | 2.3 | 1,849 | 6,550.25 | $932,500 | $932,500 | $502.75 | — | 36.5 | ||||
| Median | 2,120 | $1.07M | $1.07M | ||||||||||
Market Analysis
List vs Sale $/SqFt
Sale Price Trend
Days on Market
Sale vs List Price
This analysis was generated automatically from MLS data. For an in-depth, human-reviewed valuation, contact Joseph Sardella at josephsardella@gmail.com.